Oil is the lifeblood of industrial machinery. It lubricates, coats and protects components, removes heat, insulates and serves a multitude of other functions. Oil analysis helps to understand if the oil itself is fit for purpose and whether any abnormal wear is taking place. It informs maintenance practices when used as part of Condition Based Maintenance (CBM) and Reliability Centred Maintenance (RCM) philosophies (Introduction to Condition Monitoring), helps to extend the life of lubricant and to minimise and prevent wear.
We have prepared a number of test packages which build a comprehensive picture of oil and machine condition. These are most effective as part of routine monitoring where data trending brings further benefits. A sample of virgin oil (Knowledgebase/why test virgin oil) can be used to establish baseline parameters. A range of additional tests is available for measurement of properties specific to particular conditions and applications.
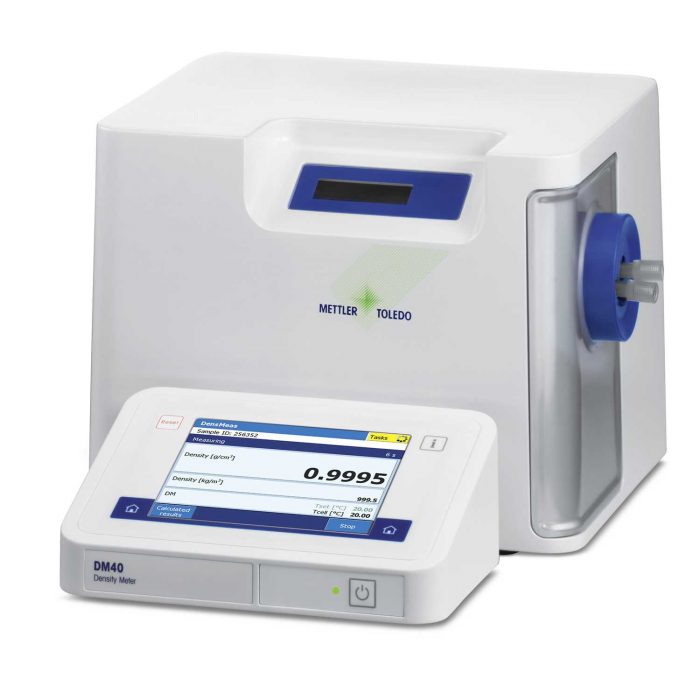
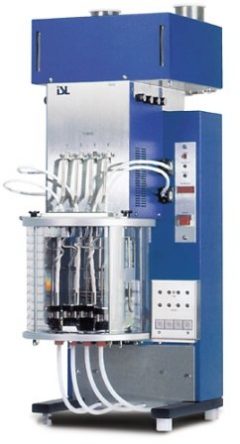 Viscosity is a measure of fluids resistance to flow. Often defined as an ISO or SAE viscosity grade (such as VG 220 or SAE 15W/40). Typically measured at 40 or 100ºC.
Each application will have a viscosity range suited to the task. Too high a viscosity can lead to lubricant starvation, wear in circulating pumps, increased temperatures and reduced efficiency. If viscosity is too low, the components will not be sufficiently separated resulting in excess friction and causing wear on the machinery.
A change in viscosity could be due to:
Viscosity is a measure of fluids resistance to flow. Often defined as an ISO or SAE viscosity grade (such as VG 220 or SAE 15W/40). Typically measured at 40 or 100ºC.
Each application will have a viscosity range suited to the task. Too high a viscosity can lead to lubricant starvation, wear in circulating pumps, increased temperatures and reduced efficiency. If viscosity is too low, the components will not be sufficiently separated resulting in excess friction and causing wear on the machinery.
A change in viscosity could be due to:
 Oil oxidises over time and becomes more acidic indicating the age of the oil. If the oil is too acidic it can damage metal components and further accelerate the ageing process.
A rapid increase in the Acid Number may be due to:
Oil oxidises over time and becomes more acidic indicating the age of the oil. If the oil is too acidic it can damage metal components and further accelerate the ageing process.
A rapid increase in the Acid Number may be due to:
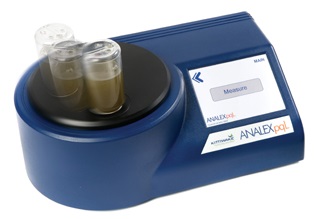 A measure of total magnetic ferrous debris in the sample irrespective of particle size.
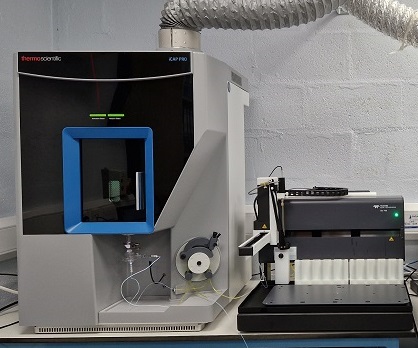 Induction Coupled Plasma Optical Emission Spectroscopy (ICP-OES) is used to measure the concentration of over 20 different elements in the oil. These include wear metals, additives and contaminants. We have recently upgraded our instrument - you can read about some of the resulting improvements
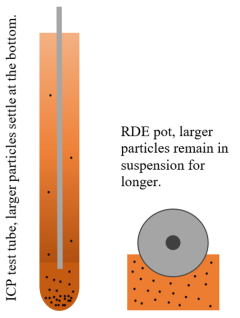
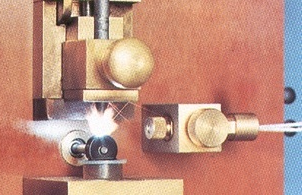 For grease and debris samples a combination of a Rotating Disk Electrode Optical Emission Spectrometer (RDE) and an ICP-OES is used. The RDE eliminates a lot of cross-contamination issues and, as no dilution with solvents is required, allows for more accurate measurement of heavily contaminated samples which would settle at the bottom of the test tube if an ICP-OES was used. The ICP-OES is then used to cover elements not measured by the RDE (mostly additives, although the wear metals are also measured). The ratio of RDE to ICP wear metal levels gives an indication of wear particle sizes.
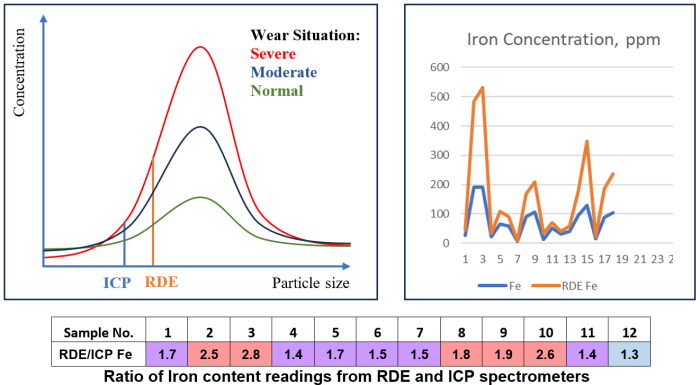
 Excess water in the oil reduces the lubricating effectiveness by disrupting the oil film, accelerates corrosion (i.e. rusting of iron and steel surfaces), depletes and/or degrades additives and accelerates the aging (oxidation) of oil. Where large quantities of water are present oil may become emulsified. The emulsions can combine with insoluble oxidation products to form sludge which impairs the operation and reliability of equipment. In addition excessive water if present as free water can promote bacteria growth or form hard deposits on bearing surfaces.
 Fluid cleanliness is particularly critical for hydraulic and turbine oils. High levels of particulates, especially if the particles are abrasive (e.g. silica), can increase wear of components and lead to reduced life and premature failure. It has been demonstrated that improving cleanliness by even a couple ISO Codes can lead to doubling of the expected life of a component. Conversely, contaminated lubricant will greatly reduce component lifespan and increase costs.
Fluid cleanliness is quantified by counting particles in prescribed ranges of particle sizes. It is typically expressed using an
Fluid cleanliness is particularly critical for hydraulic and turbine oils. High levels of particulates, especially if the particles are abrasive (e.g. silica), can increase wear of components and lead to reduced life and premature failure. It has been demonstrated that improving cleanliness by even a couple ISO Codes can lead to doubling of the expected life of a component. Conversely, contaminated lubricant will greatly reduce component lifespan and increase costs.
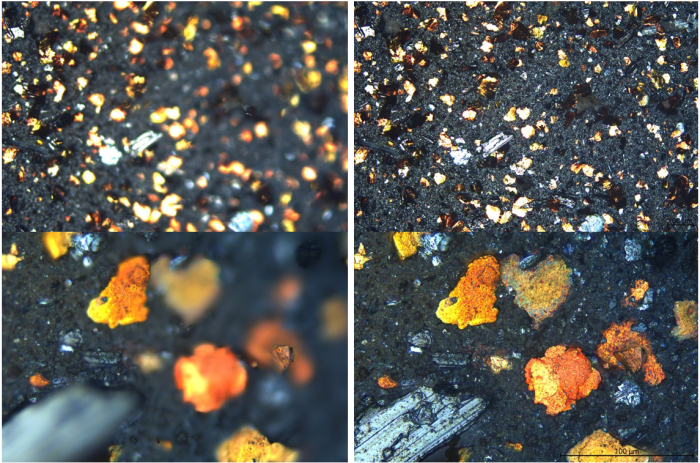
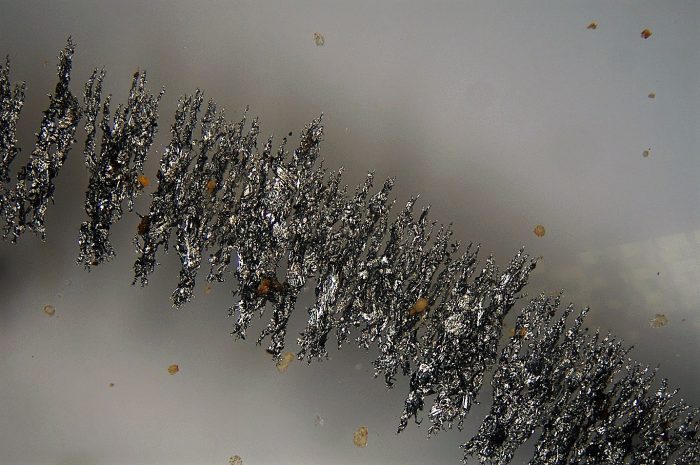
Fluid cleanliness is quantified by counting particles in prescribed ranges of particle sizes. It is typically expressed using an  We are also enjoying the Z-stack feature - it combines in-focus areas from multiple images to achieve a single fully focused composite as shown below.
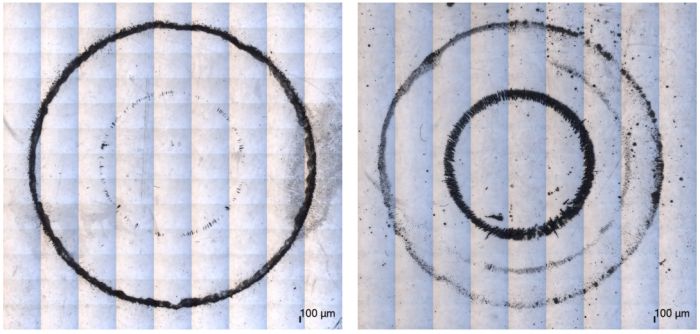
 The overview/tile stitching facility lets us construct overviews of an entire membrane or
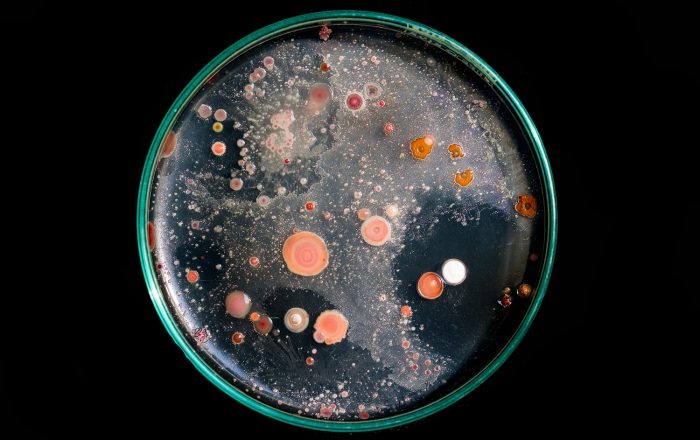
 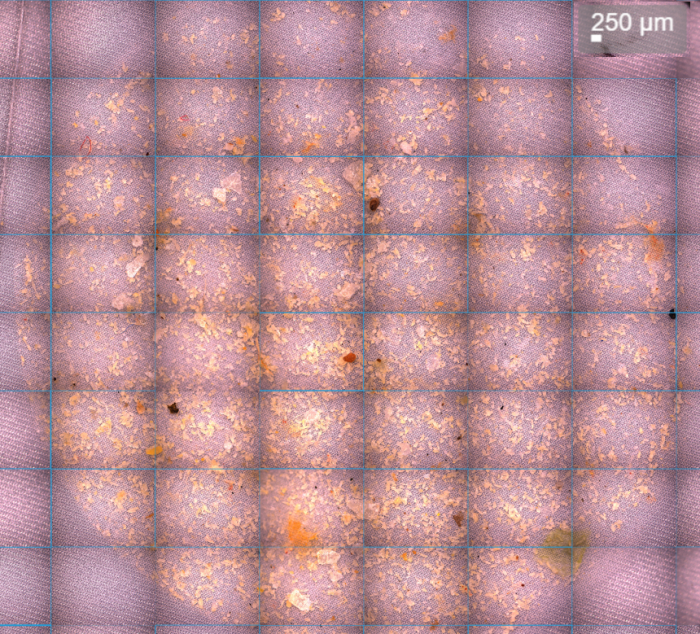 The following overviews show differences in large (inner ring) and fine (outer ring) particle densities in two ferrography samples.
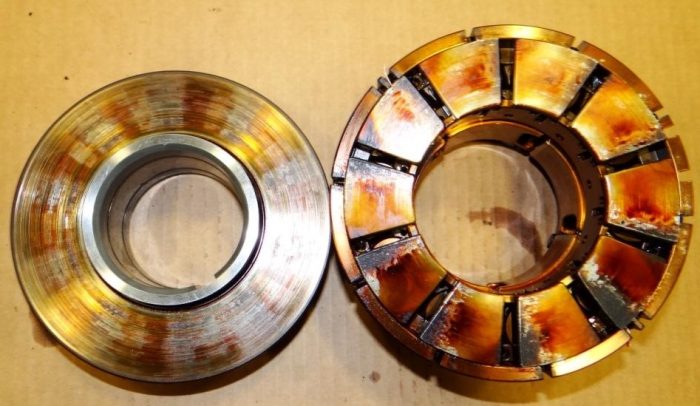
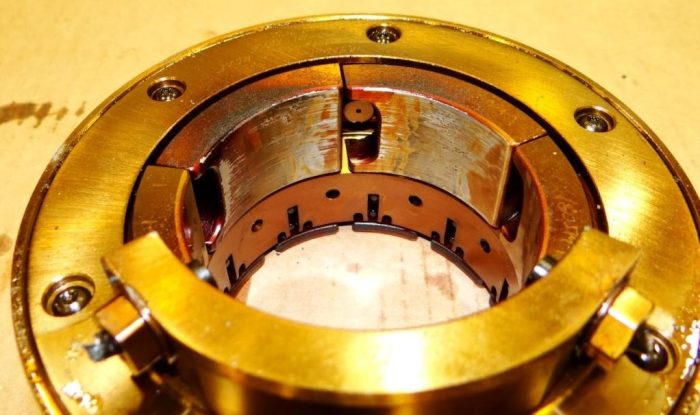
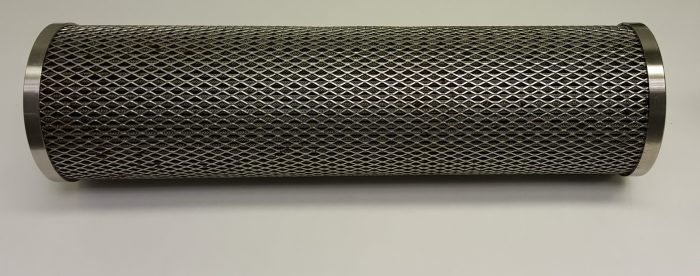 Oil filters are essential to maintaining oil cleanliness and removing wear metals and contaminants. As they perform their function, however, they also remove some of the information about wear and contamination levels from the oil stream. This is then stored in the filter itself. Fortunately Filter Debris Analysis grants us access to this store of information. By extracting and analysing the entrained particles we can learn a lot about the wear situation or the source of contamination. Oil filters come in many shapes and sizes and how we treat an individual filter will depend on its size and construction. Typically a section of the outer cage is cut out and removed to enable access to the filter media.
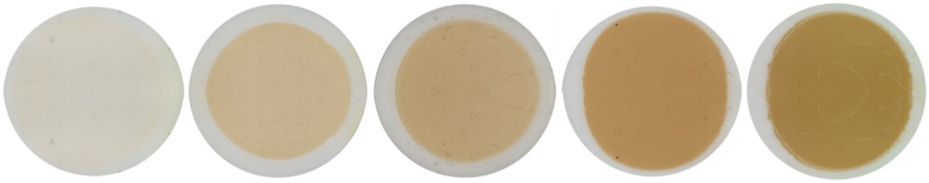
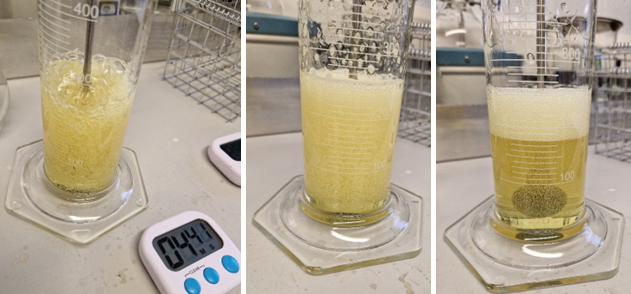
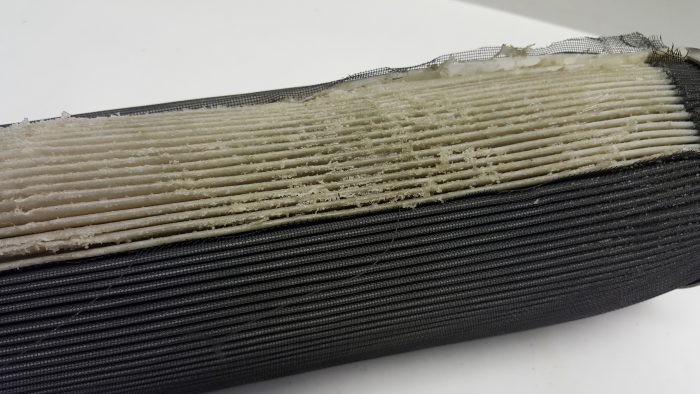 A section of the filter media is then removed and placed into a beaker. The beaker is then filled with solvent and an ultrasonic bath is used to agitate and extract the particles and any residual oil present. The solvent is then evaporated leaving the particulates and any residual oil.
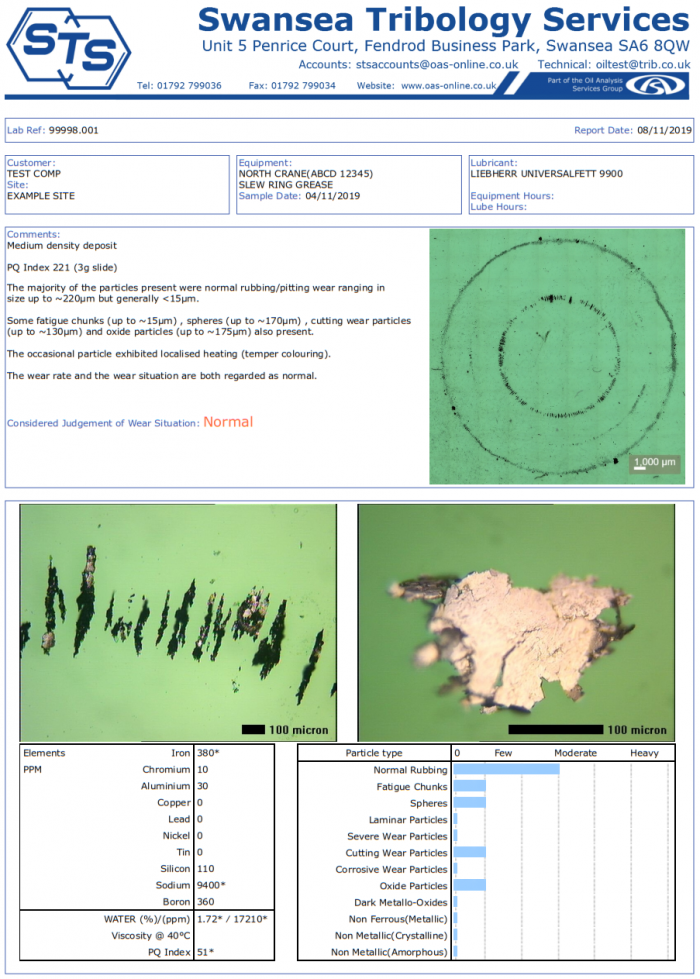
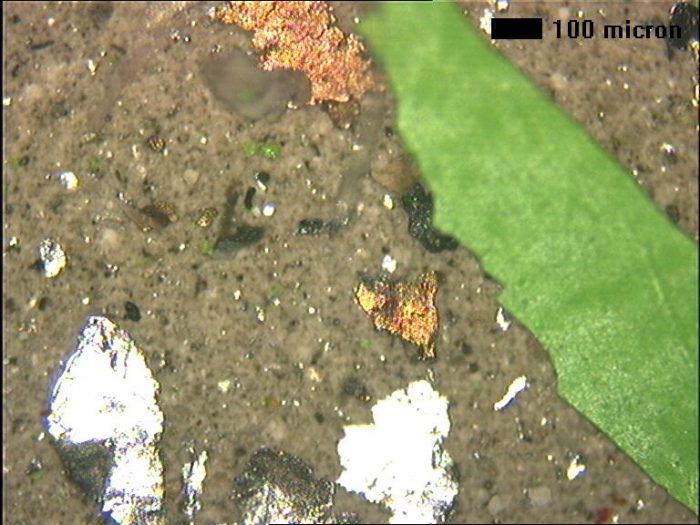 A portion of the debris is then deposited onto a filter membrane for microscopic analysis. The remaining oil/debris mixture is then analysed using a Rotating Disc Electrode Optical Emission Spectrometer to determine the elemental composition of the debris mixture. This gives a breakdown of the different wear metals and contaminants present.
Where more detail is needed, the membranes containing the particles are analysed using a Scanning Electron Microscope with Energy Dispersive X-Ray facility. This provides information on the exact elemental composition of individual particles, which can then be matched to specific component metallurgies.
A portion of the debris is then deposited onto a filter membrane for microscopic analysis. The remaining oil/debris mixture is then analysed using a Rotating Disc Electrode Optical Emission Spectrometer to determine the elemental composition of the debris mixture. This gives a breakdown of the different wear metals and contaminants present.
Where more detail is needed, the membranes containing the particles are analysed using a Scanning Electron Microscope with Energy Dispersive X-Ray facility. This provides information on the exact elemental composition of individual particles, which can then be matched to specific component metallurgies.
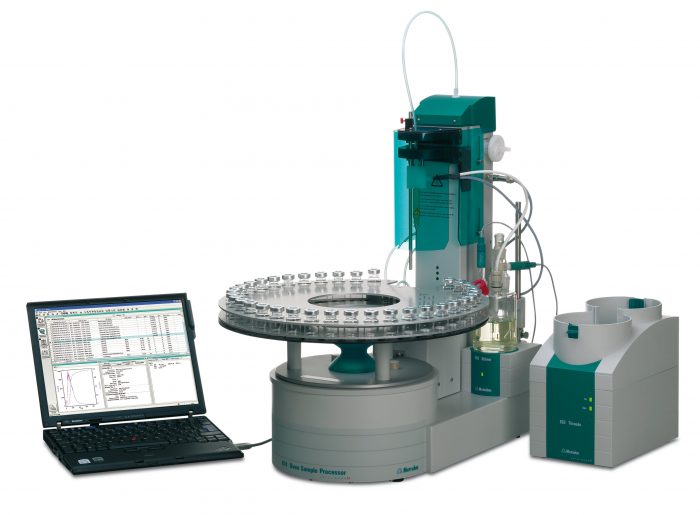
 Remaining Useful Life Estimation Routine (RULER) uses Linear Sweep Voltammetry to measure the levels of Amine and Phenol anti-oxidant additives in the oil. These are typically compared with a baseline measurement obtained from a virgin oil sample (ideally from the same batch of oil).
If anti-oxidants are allowed to deplete below a critical level the oxidation process accelerates, leading to reduced oil life and potential for varnish deposition. RULER monitoring enables management of the additive levels through top up or partial changes, significantly extending the life of the oil.
Remaining Useful Life Estimation Routine (RULER) uses Linear Sweep Voltammetry to measure the levels of Amine and Phenol anti-oxidant additives in the oil. These are typically compared with a baseline measurement obtained from a virgin oil sample (ideally from the same batch of oil).
If anti-oxidants are allowed to deplete below a critical level the oxidation process accelerates, leading to reduced oil life and potential for varnish deposition. RULER monitoring enables management of the additive levels through top up or partial changes, significantly extending the life of the oil.