Oil Analysis Reports
Here we will dissect a page from a typical oil analysis report. We do our best to make our reports as clear and intuitive as possible, but there is no harm in spending a few minutes to familiarise yourself with the layout.
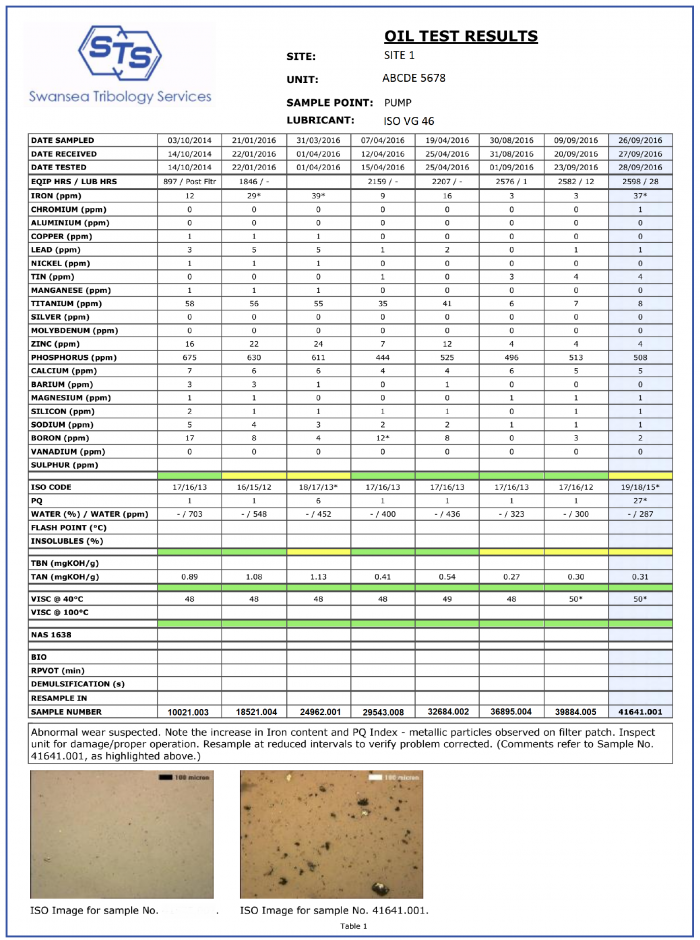
If multiple samples are being reported you may find that an overview page, has been included at the beginning of the report. This lists the samples in the order of their sample number. Sample date, site name, plant ID, unit name, sample point and lubricant type are also listed together with a “traffic light” status of the different test categories:
Ferrography – indicates if an Analytical Ferrography test has been completed, staying grey if not done, and uses colour to indicate the status of the ferrographic investigation.
Elemental Analysis – Wear, Contaminant and Additive elements.
Physical Tests – ISO Code for particulates, PQ Index, Water Content, Flash Point and Insolubles/Soot, where available.
Acidity – Total Acid Number (TAN) and Total Base Number (TBN), pH for aqueous fluids.
Viscosity – Viscosity at 40oC and 100oC where appropriate.
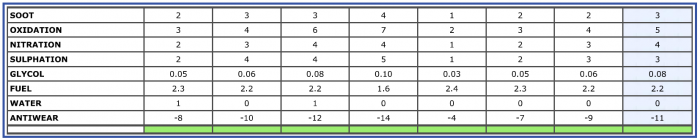
Infra Red Spectroscopy – where available.
The significance of the colours is as follows:
- Green – Normal Condition. No action required. Any parameters that may be highlighted are to be monitored by the lab when the next scheduled sample is sent in – this is to verify any potential early warnings of abnormal trends.
- Yellow – Caution, Abnormal or Marginal Condition. One or more parameters outside of normal range or abnormal rate of change observed. Refer to comments. Closer monitoring is usually recommended to confirm trend – see highlighted parameters. Condition to be reviewed by the end user, who may have greater insight into the situation and can initiate a dialogue with the lab, providing feedback, and take appropriate action if any is necessary. Corrective action may need to be considered, however may be possible to postpone depending on other factors (operating schedules, maintenance plans, cost, different tolerances or limits due to operating environment and conditions).
- Red – Critical Condition. One or more parameters are significantly outside the normal range and could lead to further wear or failure if left unattended. Refer to comments. Corrective action is required. In some cases this is caused by incorrect identification of the sample or poor sampling technique – the lab is often able to highlight such possibility and recommend that an urgent repeat sample is provided to verify.
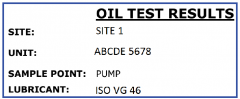
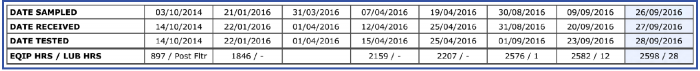
Samples are arranged in date order with the oldest to the left and the most recent sample on the right (that column is also highlighted in light blue).
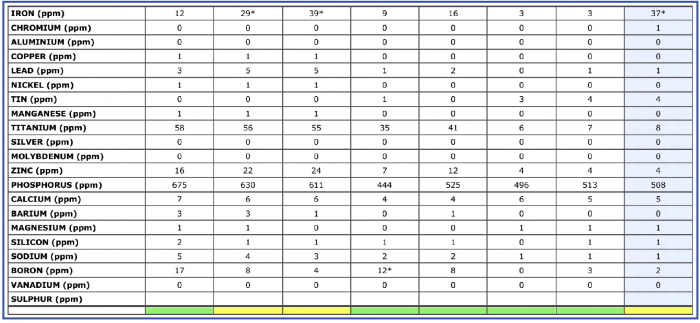
Parameters of interest (elements, viscosity, acidity, water content, etc.) are highlighted with one or more asterisks depending on severity of the condition (e.g. “29*“, “2313**”, “11324***”). Note that the threshold for severity may vary for different parameters and applications – e.g. 100 ppm of Iron may be normal for a gearbox, but 10 ppm of Nickel and Manganese may indicate significant rolling element bearing wear.
The condition of the sample with respect to elemental analysis is indicated by the colour indicator underneath each column of results.
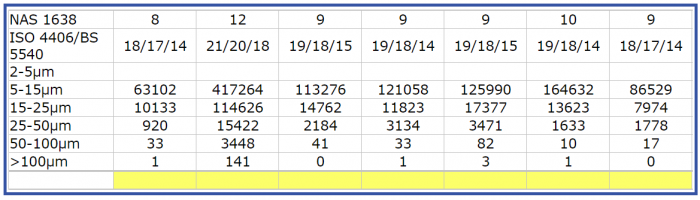
The next section of the report refers to physical contaminants, such as particulates, water, fuel and other volatile fluids, and soot. It includes results of the following tests:
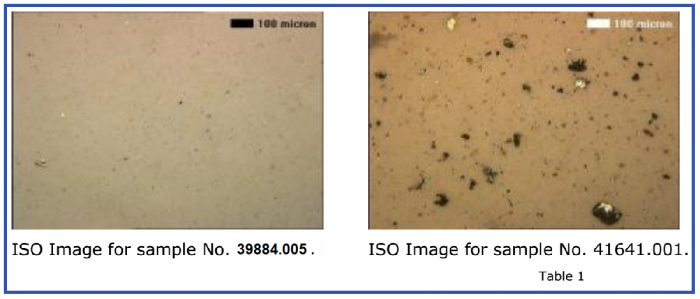
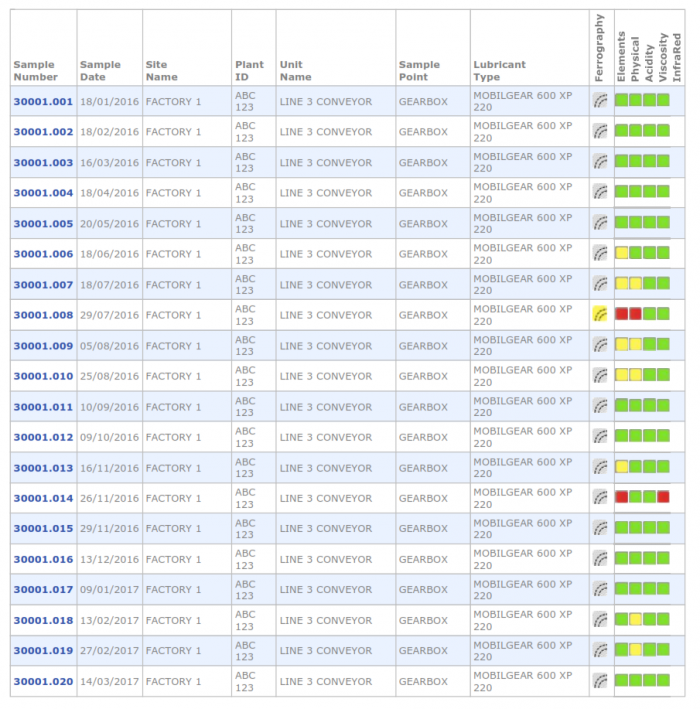
- Patch Test ISO Cleanliness Code
- PQ Index
- Water content in either %, ppm or both*
- Flash Point
- Insolubles (% Soot)
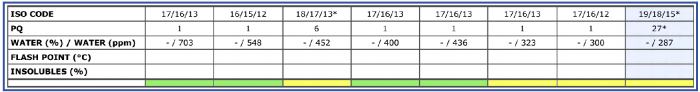
- <0.05% is displayed as 100 ppm
- Trace water contamination is equivalent to 0.05% and displayed as 500 ppm
- 0.10% is displayed as 1000 ppm
- >0.10% is displayed as 1500 ppm
- >>0.10% is displayed as 2000 ppm
The condition of the sample with respect to physical contaminants is indicated with a colour bar at the bottom of the section.
The next section describes the sample’s acidity and contains results of acid and base number measurements. For aqueous samples, such as anti-freeze coolants, acidity and alkalinity are expressed in terms of pH and reported in the TAN field with the suffix “pH” (e.g. “9.6pH”).
The condition of the sample with respect to its acidity is indicated by the colour of the bar at the bottom of the section.

The condition of the sample with respect to its viscosity is indicated by the colour of the bar at the bottom of the section.

The condition of the sample with respect to its FTIR parameters is indicated by the colour of the bar at the bottom of the section.
The following section may contain results of the Biological Contamination check, RPVOT and Demulsification tests.

Rotating Pressure Vessel Oxidation Test (RPVOT) result is given in minutes. If oxidation stability remains very good, the test may be aborted once 1000 minutes have passed, with the result then reported as “>1000”.
Demulsification Value is reported in seconds (<300 is typically satisfactory, while values >600 may give cause for concern). If the sample failed to separate fully after 1200s, the amount of oil in ml that has separated will be reported (e.g. 9ml, where 20ml is required for total separation). In this case the greater the number of millilitres separated – the better the result.
The next section contains suggested interval until next sample (only used where prescribed schedules have been provided and are adhered to).
The final line of the table contains the sample numbers, which can be used to identify samples when discussing results with the lab or to find them on the web database portal. The first part of the sample number will also match the invoice number, making it easy to verify invoices against submitted results.
Results of any non-standard analysis may also be included in the comments section.
The specificity of the comments depends on how much is known about the unit and application, how much history is available for the unit and other factors. It is often possible to improve the quality of the comments following feedback from the customer. Our service is collaborative, and if you have any questions about the results or have any information to share, please get in touch and we will be happy to discuss this with you. We may then be able to review our recommendations and issue an updated report. You can find additional information about comments and interpretation in the knowledge base section of our web site.