Despite everyone’s best efforts component failures can and do happen. While the initial concern is typically with restoring production it is important to identify the root cause of failure and prevent re-occurrence.
A failure investigation may involve initial data gathering, visual assessment of the failed unit, sampling of lubricants, analysis of wear debris and testing of the failed component. Some failure modes can be detected by a range of condition monitoring techniques, others may arrive unannounced. Failures related to wear or lubricant contamination may have indications in the oil sampling history (hopefully the potential for failure would have been identified and highlighted). Some failure modes, however, can be sudden and catastrophic without any advanced warning being visible (e.g. due to overloading). In either case there may be evidence of the failure event itself both in the lubricant and in the oil filters.
When conducting a failure investigation it is important to record all relevant information about the event, including its chronology and operational parameters. When collecting lubricant samples do not rely on the usual sample points alone – consider sampling from additional locations which may help identify origin of potential contamination, the extent of wear and other useful information. Retain oil filters – the entrapped debris can be retrieved and analysed to shed further light on the failure mode.
When removing failed components for further testing mark them to indicate orientation and fit, take photos in situ and during the disassembly process. Make sure that components are not damaged further during disassembly or, where this is unavoidable, record and identify disassembly damage to differentiate it from the original failure. If engaging assistance of experts do not clean the components until they had a chance to view them or at the very least take a sufficient quantity of high quality photographs. It is often difficult to draw conclusions when a lot of the evidence has been washed away.
See more below, and once you are ready to proceed please go to our Welcome page to get started or get in touch.
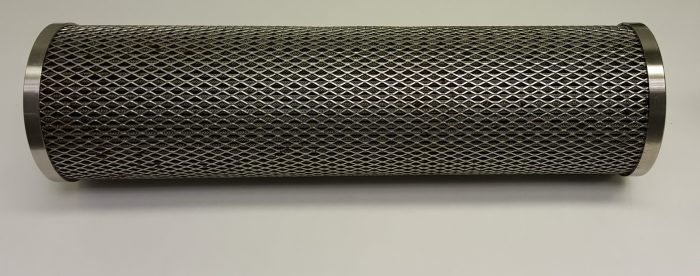 Oil filters are essential to maintaining oil cleanliness and removing wear metals and contaminants. As they perform their function, however, they also remove some of the information about wear and contamination levels from the oil stream. This is then stored in the filter itself. Fortunately Filter Debris Analysis grants us access to this store of information. By extracting and analysing the entrained particles we can learn a lot about the wear situation or the source of contamination. Oil filters come in many shapes and sizes and how we treat an individual filter will depend on its size and construction. Typically a section of the outer cage is cut out and removed to enable access to the filter media.
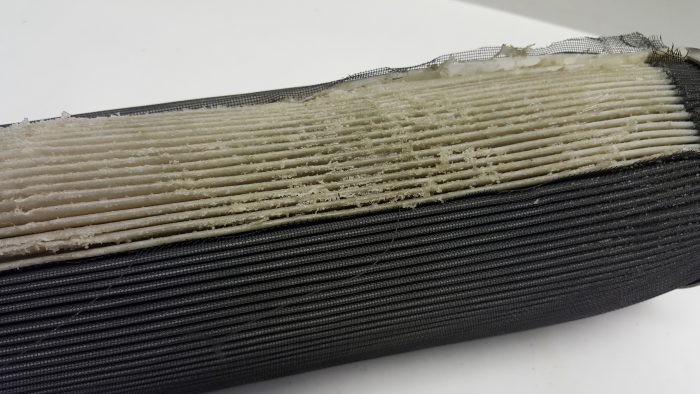 A section of the filter media is then removed and placed into a beaker. The beaker is then filled with solvent and an ultrasonic bath is used to agitate and extract the particles and any residual oil present. The solvent is then evaporated leaving the particulates and any residual oil.
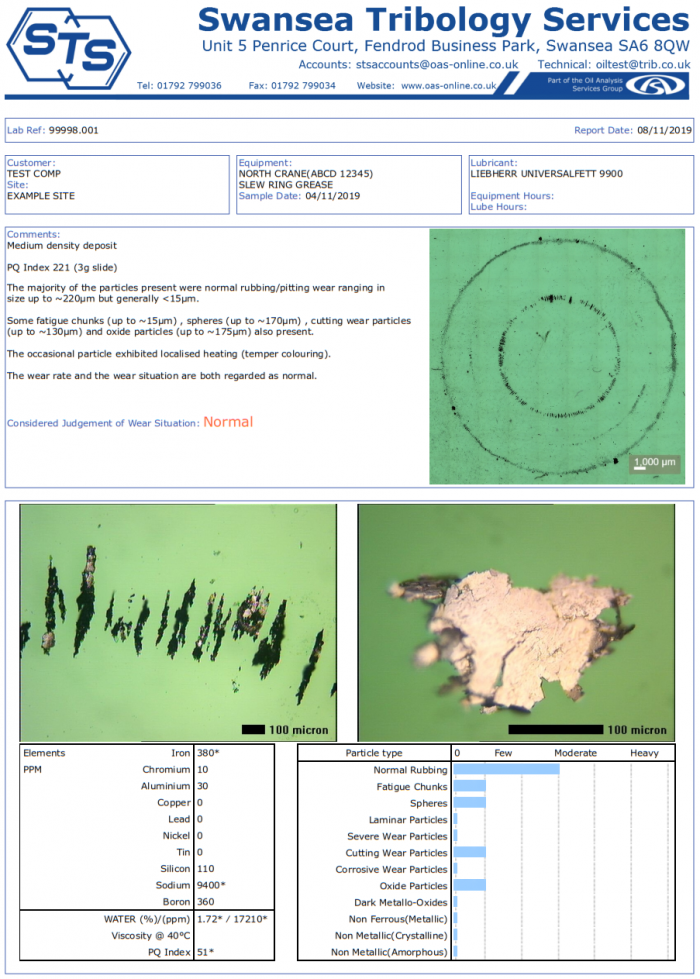
 A portion of the debris is then deposited onto a filter membrane for microscopic analysis. The remaining oil/debris mixture is then analysed using a Rotating Disc Electrode Optical Emission Spectrometer to determine the elemental composition of the debris mixture. This gives a breakdown of the different wear metals and contaminants present.
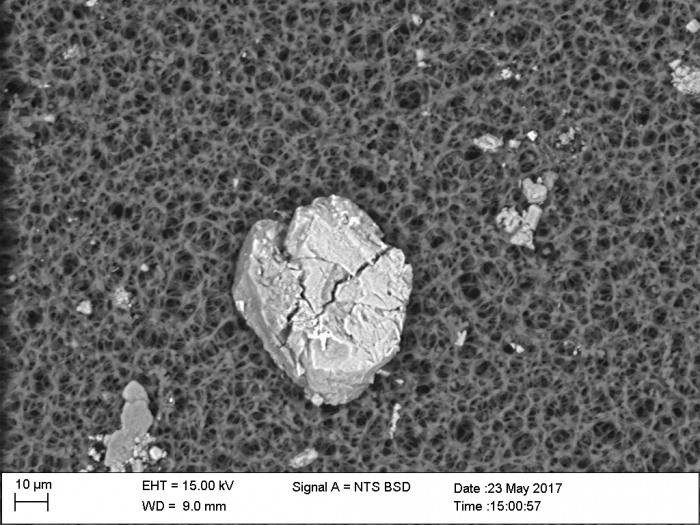
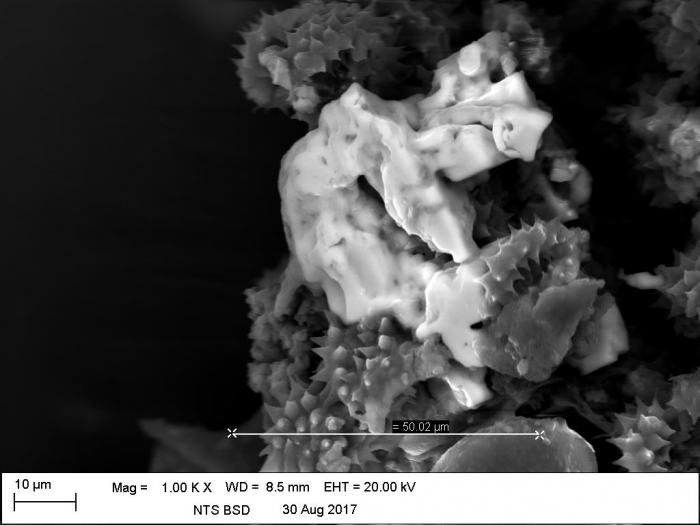
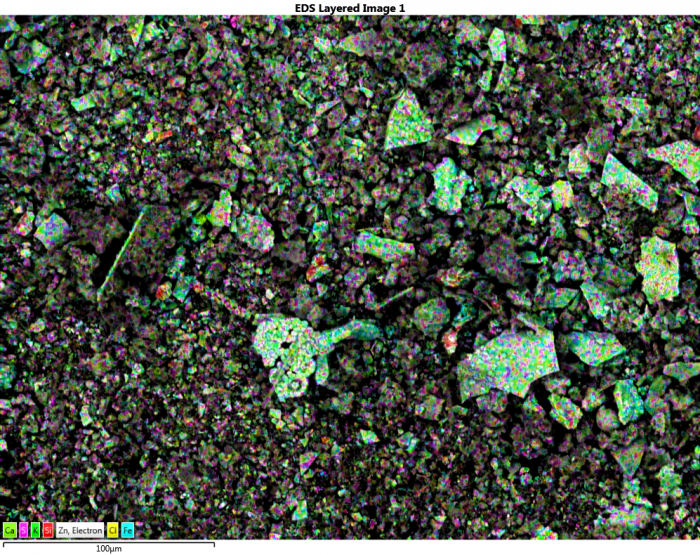
Where more detail is needed, the membranes containing the particles are analysed using a Scanning Electron Microscope with Energy Dispersive X-Ray facility. This provides information on the exact elemental composition of individual particles, which can then be matched to specific component metallurgies.
A portion of the debris is then deposited onto a filter membrane for microscopic analysis. The remaining oil/debris mixture is then analysed using a Rotating Disc Electrode Optical Emission Spectrometer to determine the elemental composition of the debris mixture. This gives a breakdown of the different wear metals and contaminants present.
Where more detail is needed, the membranes containing the particles are analysed using a Scanning Electron Microscope with Energy Dispersive X-Ray facility. This provides information on the exact elemental composition of individual particles, which can then be matched to specific component metallurgies.
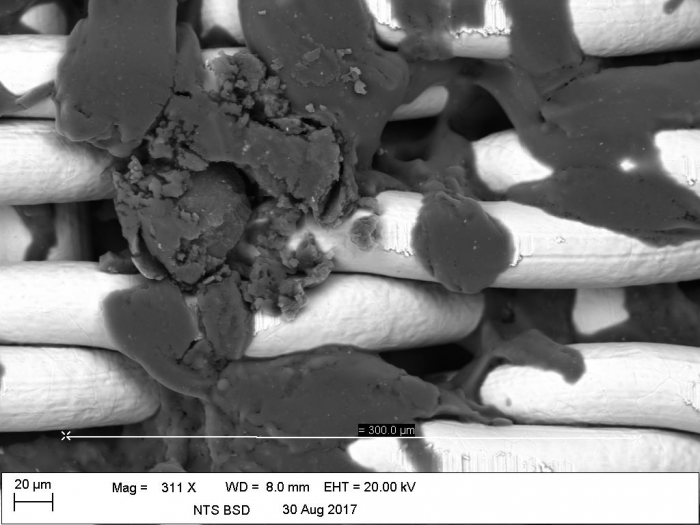
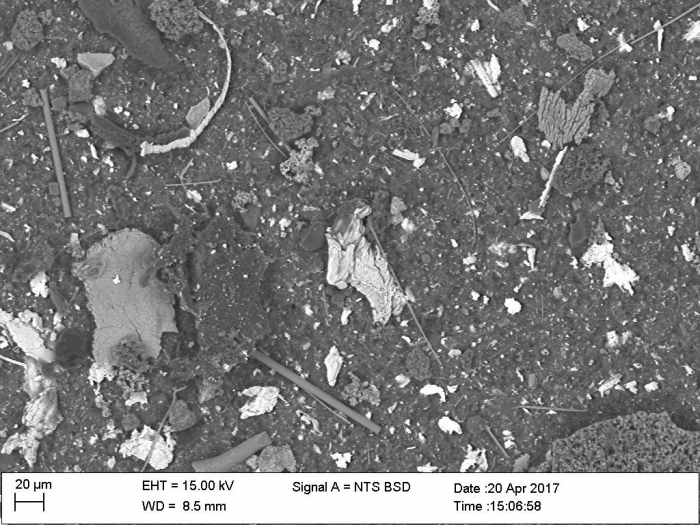
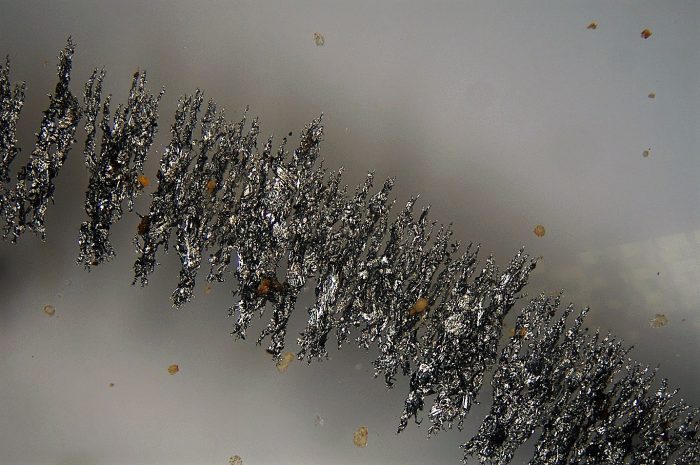
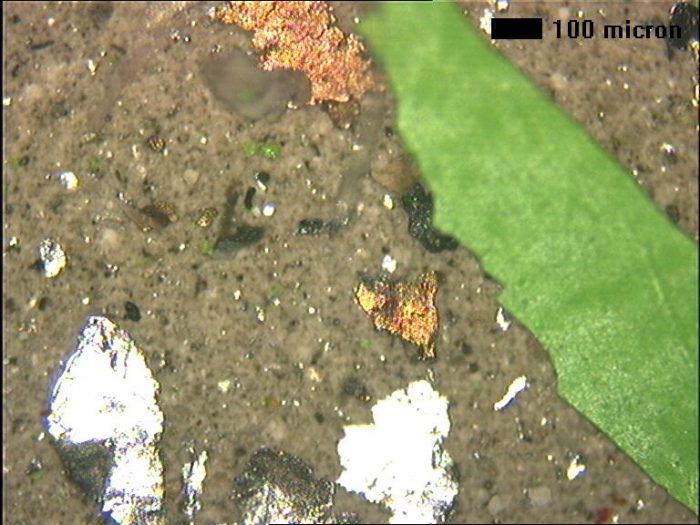
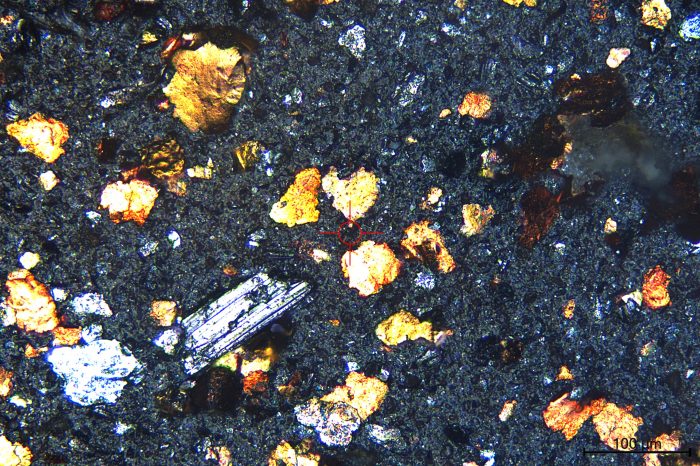 The above image shows metallic wear debris (both ferrous and copper containing) on a deposit of dark silt (fine sub-micron particles and larger debris).
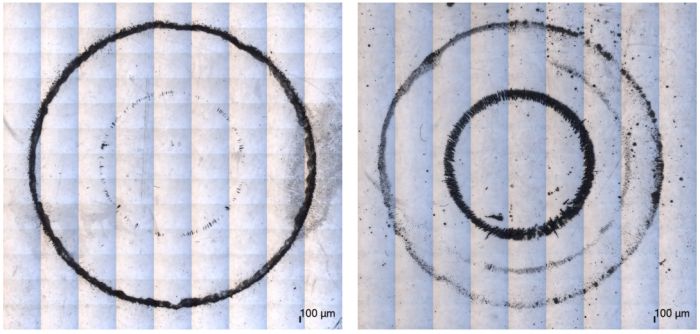
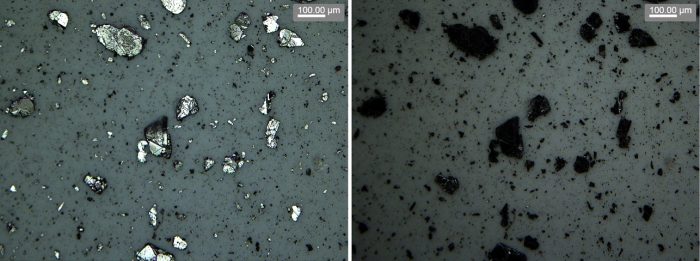 What appears to be metallic debris under incident light can be seen as dark particulates under side on illumination (dark field).
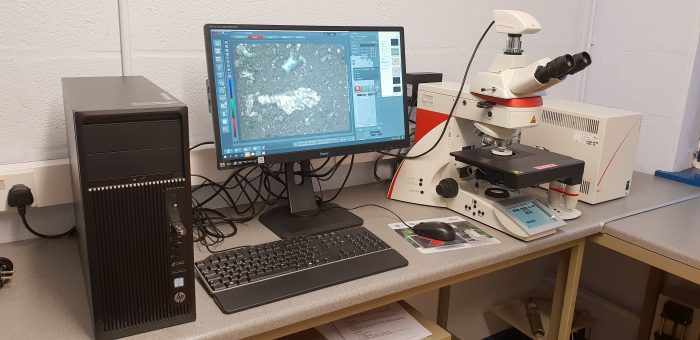 Our state of the art Leica Cleanliness Expert Microscope with motorised stage.
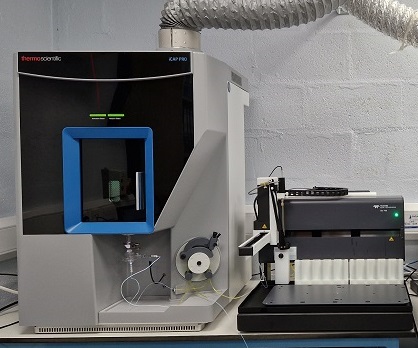 Induction Coupled Plasma Optical Emission Spectroscopy (ICP-OES) is used to measure the concentration of over 20 different elements in the oil. These include wear metals, additives and contaminants. We have recently upgraded our instrument - you can read about some of the resulting improvements
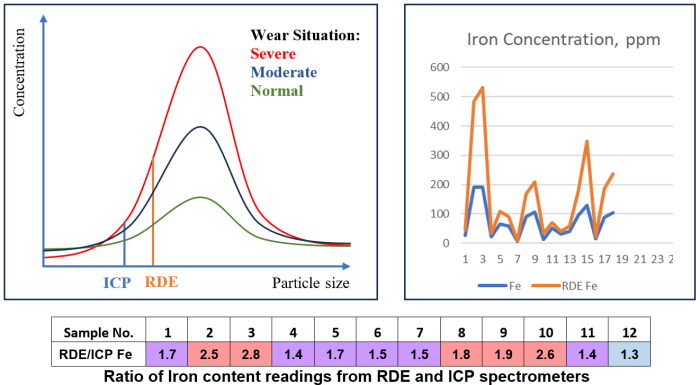
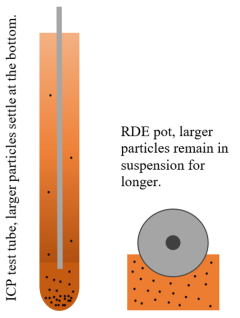
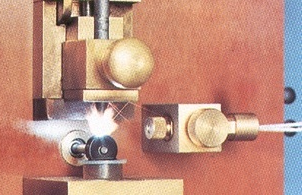 For grease and debris samples a combination of a Rotating Disk Electrode Optical Emission Spectrometer (RDE) and an ICP-OES is used. The RDE eliminates a lot of cross-contamination issues and, as no dilution with solvents is required, allows for more accurate measurement of heavily contaminated samples which would settle at the bottom of the test tube if an ICP-OES was used. The ICP-OES is then used to cover elements not measured by the RDE (mostly additives, although the wear metals are also measured). The ratio of RDE to ICP wear metal levels gives an indication of wear particle sizes.