Interpretation
Introduction to Oil Analysis Interpretation
This section will help you understand what is involved in interpreting oil analysis results. The principle is to apply our understanding of the application and the unit to the results and to derive an understanding of the condition of the lubricant and of the machine. This should then result in a recommendation for further action aimed at rectifying any faults and preventing downtime or even catastrophic failures.
Trending
 An individual sample is a snap shot in time, reflective of a current condition. It may be informative in and of itself, but when combined with historic records for the system it creates a dynamic picture of system health.
Two supposedly identical units may be operating with different background levels of wear metals or specific contaminants. A one time comparison may hint at a potential problem for whichever unit is showing higher levels of ferrous wear, however analysis of historic trends may indicate that both have settled into a normal wear mode. In contrast, a higher rate of change in a sample with lower concentration of wear metals may be indicative of an abnormal condition, while a steady yet higher absolute value may give no cause for concern.
Sampling Frequency
Regular sampling enables dynamic monitoring of trends. Consider the following criteria when choosing sampling frequency:
- Cost of Failure – remember to consider safety, downtime, repair and business interruption costs. Include any direct penalties for failure to deliver as well as reputational damage.
- Fluid Environment Severity – operation and fluid conditions influence both the frequency and the speed with which a failure progresses. Consider loads, speed, temperature, pressure, operating patterns and likelihood of contamination.
- Machine Age – chances of failure are highest during the break-in period, near the end of expected life and after major repairs and overhauls. Increase sampling frequency during these periods to improve detection efficiency.
- Oil Age – sampling recently changed oils can help ensure that addition of the wrong lubricant is spotted early. Incorrectly specified, defective or mixed lubricants can be identified before significant damage takes place. When nearing the end of useful life increase frequency to monitor additive depletion, onset of oxidation or high contamination levels.
Oil sampling is a means of controlling the risk of failure. The first point above defines the consequence of failure and points 2-4 relate to its probability. Correctly setting sampling frequency is crucial to mitigating risk.
We can work with you to devise a sampling schedule that suits your needs.
At the same time our analysis interpretation also includes recommendation on any changes to the current rate of sampling based on the latest results. This may take form of reduced sampling interval to monitor a developing fault, an immediate repeat to confirm a severe condition or confirmation that current frequency remains appropriate.
Working with You
We don’t believe in working in isolation. Best results are achieved by combining our expertise in Oil Analysis with your knowledge and understanding of the machine and its operating conditions and environment.
Our comments and recommendations are based on our knowledge and experience and always require some assumptions. We do our best to highlight those assumptions and to solicit feedback where necessary and indeed available. At the same time if you feel you can add something to the interpretation by volunteering further information we would actively encourage your participation. To aid this we have included the ability for you, as a customer, as well as other trusted users, to add comments to the web database. You are of course always welcome to call, email or carrier pigeon your feedback to us as well.
Once new information becomes available the results are reviewed and comments amended if a change is warranted. The revised reports are then reissued. Any customer feedback is registered in the customer comments field with reference to source, time and date as well as mode of communication.
An example of this in operation may be us receiving a sample without an oil grade having been specified. As viscosity is one of the most important properties of the oil it is always worth making the effort to find out the expected/required grade. The report will typically state that note should be taken of viscosity as no data has been provided on the grade. The customer can then review their records, or if none available make an assessment of the machine and its viscosity requirements. Once we hear back, we would amend the record with the grade information provided and review the results against the new criteria received. The comments would then be updated to reflect conformance with the grade and the report would be reissued.
Representability - samples as received
Oil Analysis is essentially a chain of processes and activities from the initial analysis of the system and its sampling needs, through sampling, shipping, receipt at the lab, testing and interpretation, customer review, feedback and any resulting action.
The information produced by oil analysis is only as strong as the weakest link in this chain. This is why we not only put a lot of effort into ensuring accurate testing at the lab, but also engage with you to make the entire process more robust at every stage. We aim to educate you and your colleagues and empower you to engage with the lab at every stage. The service is not just numbers falling out of a black box, but helpful interactions with human beings interested in delivering a valuable service.
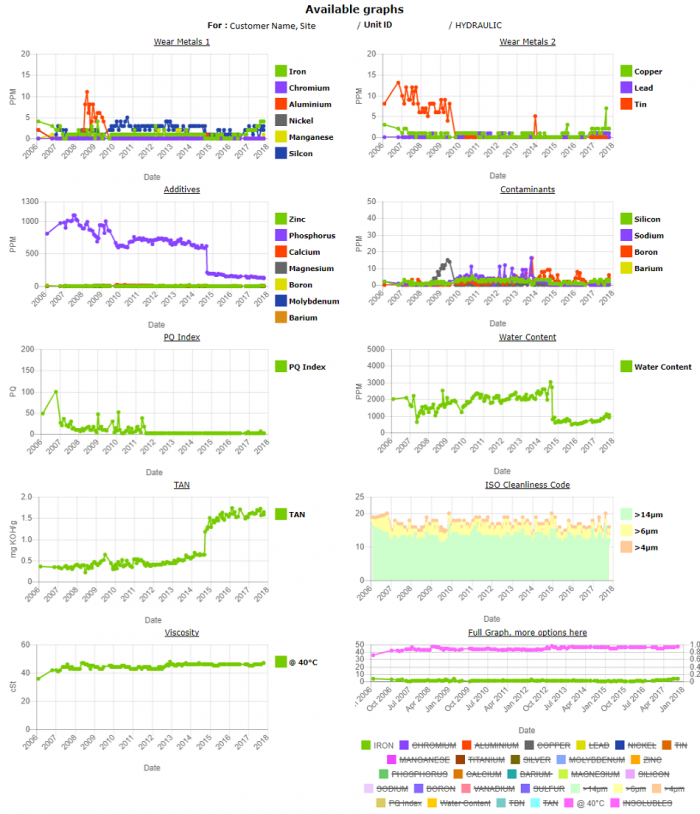
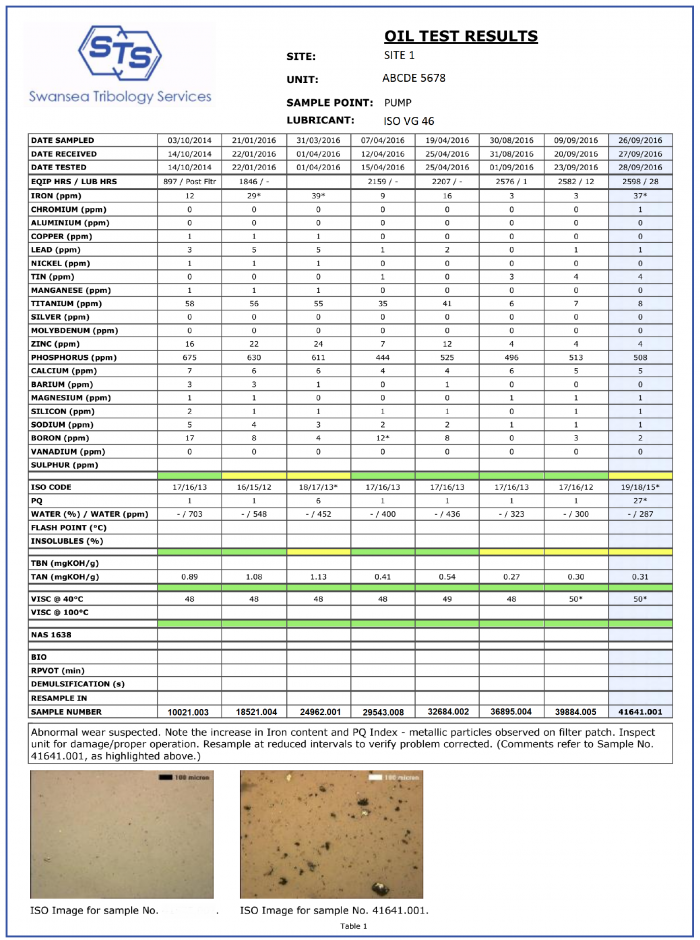
Anatomy of an oil analysis report
The layout of a typical oil analysis report is explored here.
Limits
We get many requests for Limits data from our customers.
It is very reassuring to look at your results, then look at the limits table – find where they fit, then file the report away satisfied that it’s been dealt with.
In practice things are not that simple.
It is difficult to give specific limits for most of the measured parameters. When analysing the results we have to take into account a wide range of factors, such as, in no particular order:
- Unit type (gearbox, engine, bearings, hydraulics, turbines, etc all have very different requirements and limits)
- Application/operation parameters (size, load, rotation speed, continuous or intermittent operation, etc)
- Environment (indoors in a spotless pharmaceutical facility or outside in a quarry, a steelworks or on an oil platform)
- Criticality (one of several redundant compressors, a production critical gearbox or a safety critical generator/fire pump engine on an oil platform)
- Previous history and current trends (especially rate of change, see example below)
- Equipment hours and hours since last oil change (unit in use 24/7 or intermittent standby operation; 8 years on the same fill of turbine oil or 1 day after an oil change)
- Lubricant type (viscosity grade, formulation)
- Population data (e.g. values of the equivalent parameter from the other 30 turbines in the batch)
- Results of other confirming parameters (e.g. flash point to confirm fuel dilution is the cause of reduced viscosity)
- Customer specific requirements and attitudes, customer’s own limits where available (water content limits in a pharmaceutical facility as compared to steel rolling plant)
Even for the same unit types (e.g. diesel engines or generators) different manufacturers may have different limits. And identical engines may have different effective limits when working in different environments – a backup generator in a hospital faces different challenges from a power generator in a dusty quarry setting.
The rate of change is a critically important factor – a linear increase in wear or contamination (e.g. the leftmost plot in the following figure) may be indicative of normal operation. A change in slope may indicate accelerated wear (the middle plot) and may require further investigation and remedial action even though the absolute values are lower. The rightmost graph shows what happens when sampling interval is too long. It has four of the same points as the middle graph, and represents an example where an oil change may have inadvertenly rectified and masked the issue without the user being aware of the problem having arisen. An oil change may indeed remove the contamination responsible for the increase in wear, but, without knowing about it, any additional remedial steps (e.g. changing seals, breathers) may be inadvertently missed out.
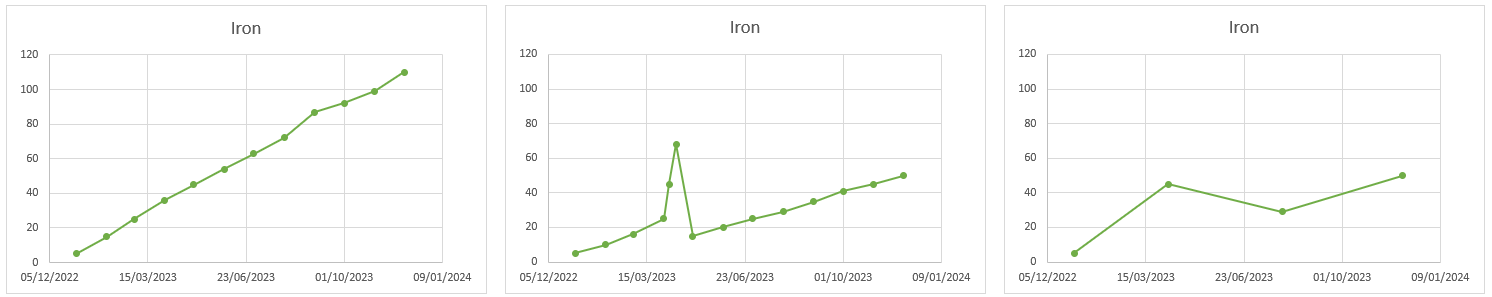
In each of the above examples the absolute value may have been within the limit for the particular application, but the increased rate of wear generation warranted prompt action in the middle example and would have been missed if specified limits were the only deciding factor.
This is why you need to refer to the diagnostic comments at the bottom of each oil analysis report. In the following section we will clarify some of the commonly used diagnostic phrases.
Diagnostic Phrases
In the diagnostic comments at the bottom of each report you will see our effective grading of the situation somewhere along the lines of:
Normal – continue in service.
Something has been highlighted or mentioned, but still continue in service. This is likely a very early and potentially uncertain indication of a developing issue/fault. Perhaps consider more frequent sampling, especially in the initial period if no historical trends available (Monitor at reduced intervals). The deviation may potentially be explainable by a range of factors, such as a poorly taken sample (e.g. insufficiently drained sample point, unit not up to temperature, bottom of sump sampled), change in operational or environmental conditions, etc.
Determine source of contamination – where a contaminant is detected (e.g. Silicon, water, other process contaminants). Identify source of contamination. Prevent further ingress, take measures to remove contamination (e.g. through filtration, draining excess water, etc). An oil and/or filter change may be advised depending on severity.
Check system target cleanliness requirements – we believe that the ISO Cleanliness Code is higher than is acceptable for the type of system tested. Refer to own cleanliness limits as they may differ and, if required, take measures to improve cleanliness levels through filtration or flushing/oil change.
Inspect unit for proper operation – more of a concern, perhaps assess any other data you may have (e.g. vibration, visual, touch for vibrations, thermal info, etc) to see if action may need to be considered. Normally would want to sample more frequently to build trend.
Inspect unit for damage/proper operation. Likely with a recommendation to consider or perform an oil/grease change once remedial action taken and condition verified as suitable to continue – there is a concern about the condition with some damage potentially expected. Action is necessary, however may be possible to postpone if operational constraints do not allow an immediate response.
Critical wear or contamination levels detected – as above but with more urgency to act. Delays may lead to further wear (including in other parts of the system) and potentially to catastrophic failure. Where the system is safety critical action should be taken ASAP.